No products
Prices are tax excluded
Product successfully added to your shopping cart
There are 0 items in your cart. There is 1 item in your cart.


DUAL-KLAS-NIR P700, Plastocyanin, Ferredoxin & Chlorophyll Fluorescence Measuring System
DUAL-KLAS-NIR
New
The DUAL-KLAS-NIR represents a significant advancement over the well-established DUAL-PAM-100 system. The DUAL-PAM-100 employs one pair of wavelengths in the near infrared (NIR) to measure absorption changes related to redox alterations of the photosystem I reaction center. Using four wavelength pairs in the NIR, the DUAL-KLAS-NIR is capable of unequivocally discriminating redox changes of plastocyanin (PC), PS I reaction center (P700) and ferredoxin (Fd).
- Consulta este producto
- Remove this product from my favorite's list.
- Add this product to my list of favorites.
| Type of Instrument | Fluorescence Meter |
| The instrument measures: | Chlorophyll Fluorescence |

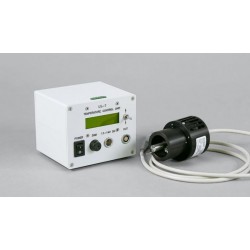
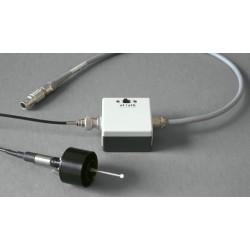
DUAL-KLAS-NIR control unit (DKN-C) left with the emitter and detector units held by the Linear Positioning System in the vertical position on the right hand side.
- By applying an innovative analytical approach, the DUAL-KLAS-NIR acquires the in vivo spectral characteristics of pure PC, P700 and Fd. This spectral information allows to monitor online the redox changes of P700, PC and Fd, and to determine ratios of PC/P700 and Fd/P700.
Like the DUAL-PAM-100, the DUAL-KLAS-NIR is also a PAM chlorophyll fluorometer. The device can excite fluorescence by green or blue PAM measuring light. Green light penetrates deeper than blue light into the leaf. Thus, green-excited fluorescence includes information from deeper leaf layers and, thus, is well-suited for comparison with the NIR absorption measurements which always probe the entire leaf.
- The software of the DUAL-KLAS-NIR shares many features with that of the DUAL-PAM-100. Hence, getting started with the DUAL-KLAS-NIR is particularly straightforward for users of the DUAL-PAM-100. Using automated measuring routines of DUAL-KLAS-NIR software, even complex measuring protocols can be easily performed.
- Outstanding Technical Features:
- DUAL-KLAS NIR instruments can measure in 1, 2 or 6 channel mode, with time resolutions of 35 µs, 150 µs and 1 ms, respectively.
- The pulse modulation technique developed for the DUAL-PAM-100, in which the different channels are measured as blocks of 50 µs has been extended for the DUAL-KLAS-NIR to accommodate 6 channel measurements (see Fig. 2).
- The DUAL-KLAS-NIR uses green measuring light for the fluorescence measurements to get the best possible match between fluorescence and absorbance measurements. A second fluorescence channel detects the fluorescence induced by blue measuring light. The blue measuring light gives more specific information on the upper or lower side of the leaf and in addition gives a fluorescence signal that is one order of magnitude larger than the signal induced by the green measuring light.
- Other Distinctive Features of the DUAL-KLAS-NIR:
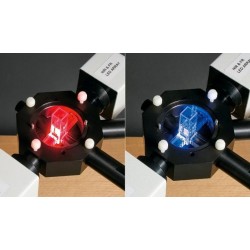
- Integrated red, blue, far-red actinic LEDs, whereby the 635 nm red LED-array is used as the light source for continuous actinic light, multiple turnover pulses and single turnover flashes. The blue 460 nm LED in the detector unit allows a continuous illumination with 300 µmol m-2 s-1 from the detector side of the sample.
- The measurement of four wavelength pairs in the near-infrared: 785-820, 820-870, 870-950, 840-950 nm.
- Both sides of the leaf can be illuminated to achieve the most homogeneous illumination of the leaf possible.
- An extremely wide range of measuring light frequencies (1 Hz to 400 kHz allows continuous assessment of the FO level as well as recording of fast kinetic transients at high time resolution (e.g. the polyphasic fluorescence rise or flash relaxation kinetics).
- All light sources can be switched with 2.5 µs time resolution under software control. If single channel measurements are made, a script is available with which the different signals can be measured consecutively at high time resolution.
- Other important technical features are: 1. Automated Slow Kinetics recordings; 2 pre-programmed Triggered Runs; 3. on-line and off-line averaging; 4. Operation of the instrument via automated measuring routines (script file programming).
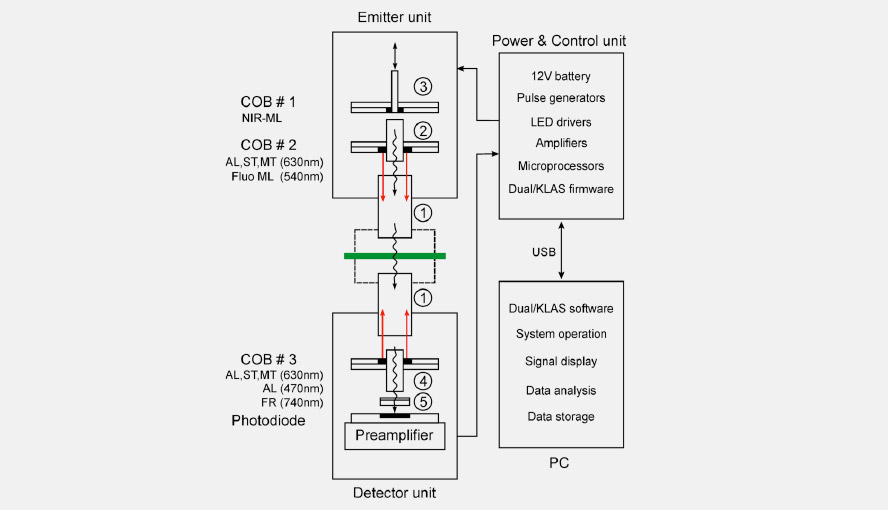
Scheme showing how the different light sources and the photodiode are oriented relative to each other in the DUAL-KLAS-NIR. ML = measuring light, AL = actinic light, ST = single turnover flash, MT = multiple turnover pulse, FR = far-red light, COB = chip-on-board (LED-array).
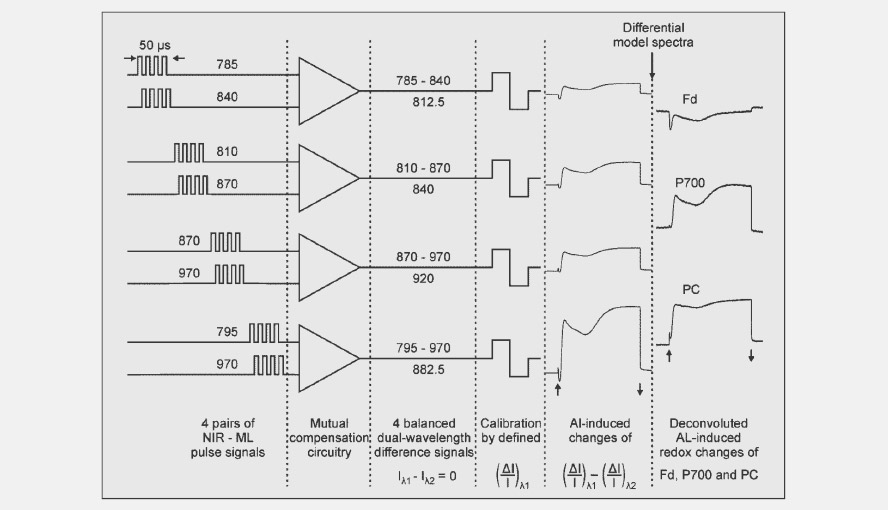
Scheme showing how the wavelength pairs are measured sequentially in blocks of 50 µs after which the signals after a few more steps, with the help of the differential model plots, are deconvoluted and turned into PC, P700 and Fd signals.
- Differential Model Spectra (DMPs) for the deconvolution of the NIR-signals
- The absorption spectra of P700, plastocyanin (PC) and ferredoxin (Fd) are broad and show few features in the near infrared (NIR). A further complication is that the extinction coefficient of P700 is much higher than that of PC, which is higher again than the extinction coefficient of Fd. By choosing specific wavelength pairs it is only possible to get NIR-signals enriched in Fd (785-820 nm), or P700 (820-870 nm) or PC (870-950 nm). To get from there to a clean deconvolution, the software makes use of the differential model plot (DMP) approach, which does not require knowledge of difference spectra and the wavelength dependence of differential extinction coefficients. Christof Klughammer first developed this method for the KLAS-100, a kinetic LED array spectrophotometer for the 510-570 nm wavelength range.
- We know the behavior of PC, P700 and Fd under standard conditions quite well and we can, on the basis of that knowledge, design experiments in which, for a short period of time, only redox changes of one of the three components (PC, P700 or Fd) occur. By normalization of the values determined for the 4 difference signals a “spectral fingerprint” for each component is obtained under the given experimental conditions. It should be noted here as well that the FA and FB iron-sulfur centers located on the acceptor side of photosystem I may also contribute to the Fd-signal.
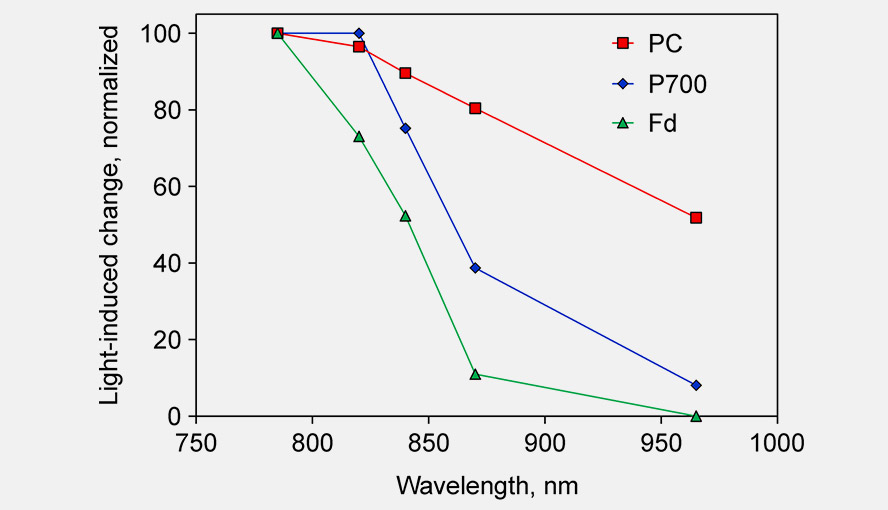
Single wavelength transmittance changes in an intact sunflower leaf induced under conditions favoring selective redox changes of either PC, P700 and Fd. The DUAL-KLAS-NIR was used in single beam mode (Schreiber 2017, Fig. 2). For further details on this experiment see the legend of Supplementary Figure 4 in Klughammer and Schreiber (2016). The figure shows that between 780 and 820 nm the Fd-signal decreases by 30%, whereas the changes in the PC and P700 signal are small or essentially zero, respectively. Between 820 and 870 nm there is a big decrease in the P700 signal, whereas the PC signal change is relatively small. The change in the Fd signal is big as well (~60% change), but the Fd signal intensity in absolute terms is much smaller than the P700 signal intensity. Between 870 and 965 nm PC and P700 show a comparable decrease. The PC enrichment in this wavelength interval is rather small, but is the best that can be done. The figure illustrates two points: 1. why the particular wavelength pairs used in the DUAL-KLAS-NIR were chosen and 2. that the precise wavelength values of these pairs are less important. If e.g. 950 nm is chosen instead of 965 nm, that will not affect the deconvolution approach.
Screenshot of the experiment used to obtain the DMP for P700. In a light adapted leaf being illuminated by far-red light, a 1 ms AL pulse induces almost exclusively changes in the P700 signal.
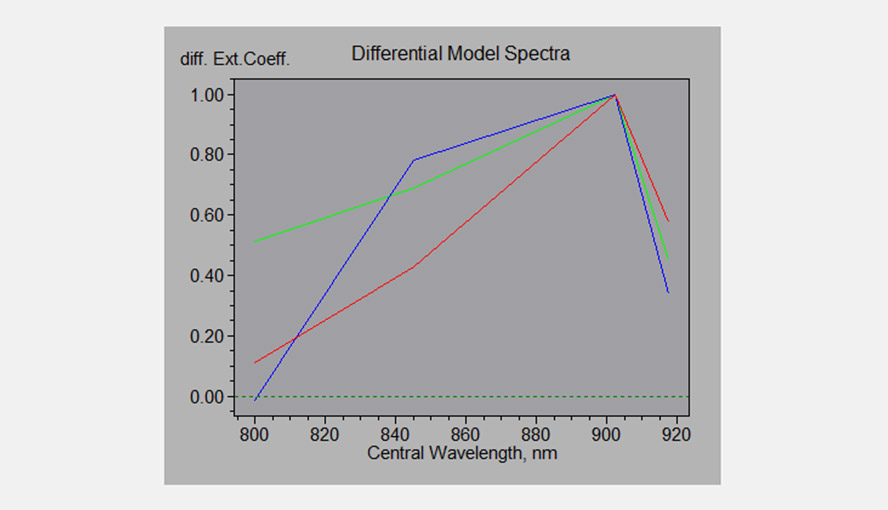
Differential Model Spectra of the P700, PC and Fd; the software uses these DMPs to deconvolute the four NIR signals.
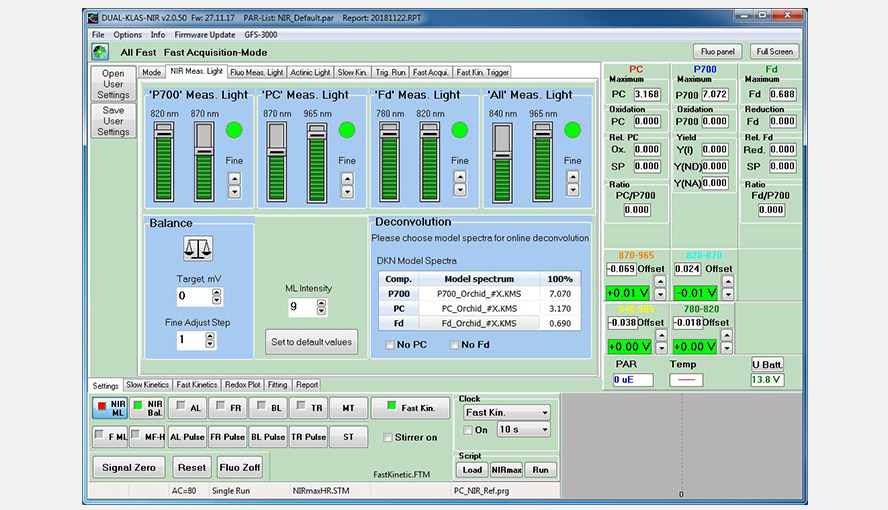
Screenshot of the NIR-measuring Light window following balancing of the four wavelength pairs and import of the differential model spectra (DMPs) of the orchid Phalaenopsis.
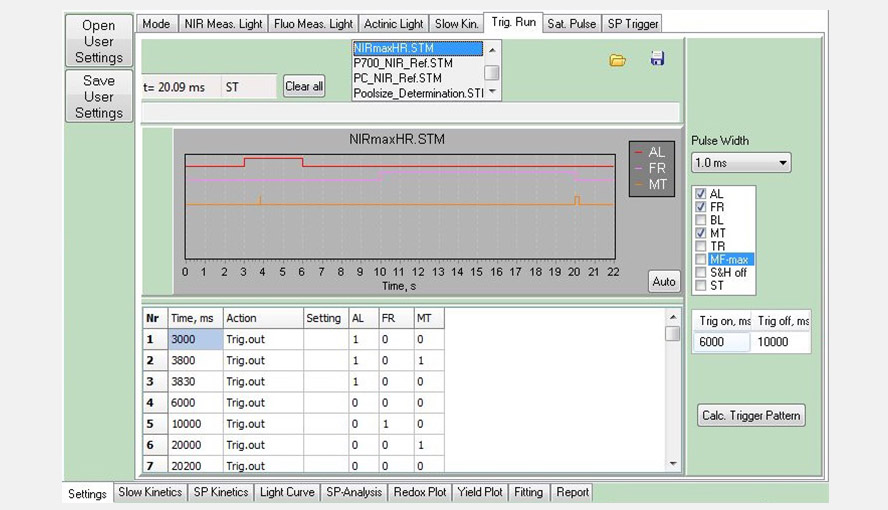
Screenshot of the Trig. Run window, showing a measurement consisting of three events: actinic light (AL, red) between 3 and 6 s, far-red light (FR, pink) between 10 and 20 s and multiple turnover pulses (MT, orange) at 3.8 and 20 s. Triggered Runs belong to the building blocks of script files.
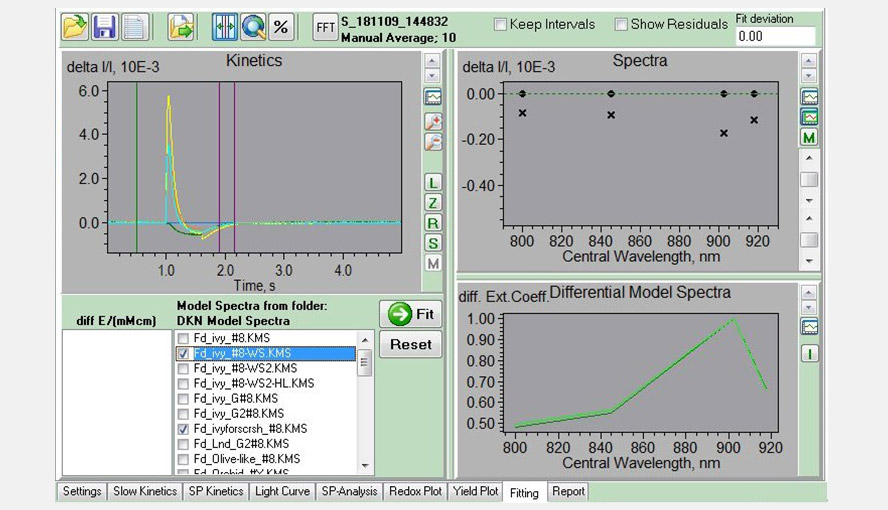
Screenshot of the Fitting window, showing an experiment with a Phalaenopsis leaf to determine the Fd-DMP (pulse of light followed by dark period) in the left panel. The four traces (sea green, green, yellow and orange) represent the measurements of the four wavelength pairs. The purple lines give the interval used for analysis and were only Fd-re-oxidation is expected to occur. A comparison between the DMP of this leaf and that of a Hedera helix leaf is shown in the right bottom window.
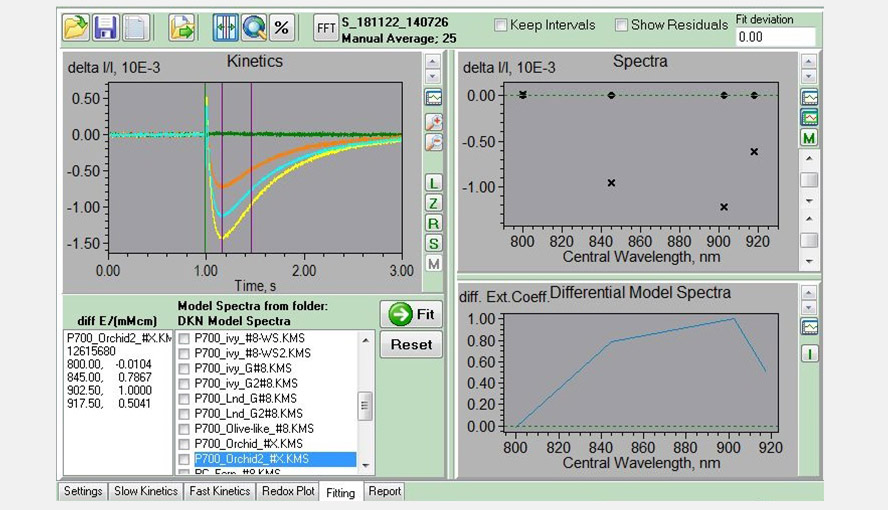
Screenshot of the Fitting window. Experiment with a Phalaenopsis leaf used to determine the P700-DMP (light adaptation leaf, FR-light, 1 ms MT with FR background light) shown in the left panel. The four traces (sea green, green, yellow and orange) represent the measurements of the four wavelength pairs. The purple lines give the interval used for analysis and were only P700-redox changes are expected to occur.
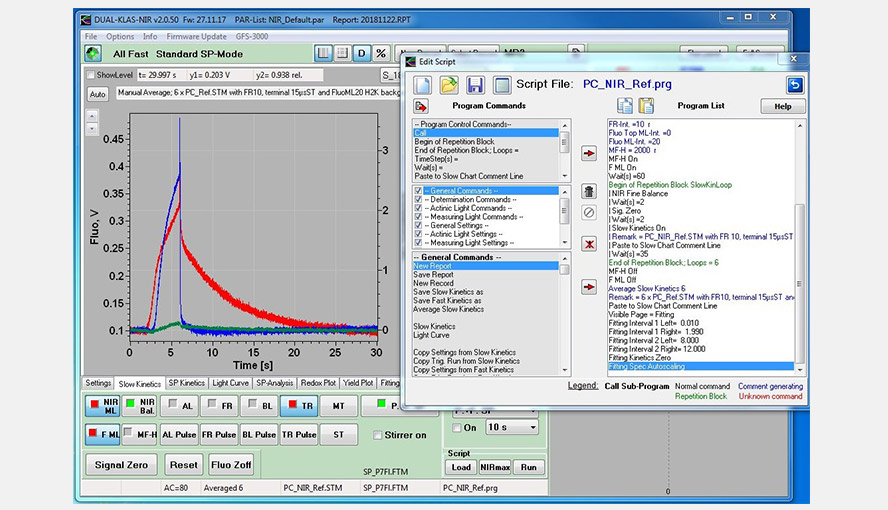
Screenshot of the Slow Kinetics window showing the experiment with a Phalaenopis leaf to determine the PC-DMP (light adaptation, FR light, Saturating flash followed by a period of darkness). The signals were deconvoluted on the basis of the DMPs of Hedera helix included in the software. The experiment shows clearly that beyond 9 s only changes in the PC redox state occur under these conditions. A script defining the experiment shows up as a pop-up window and was here shifted on top of the Slow Kinetics window.
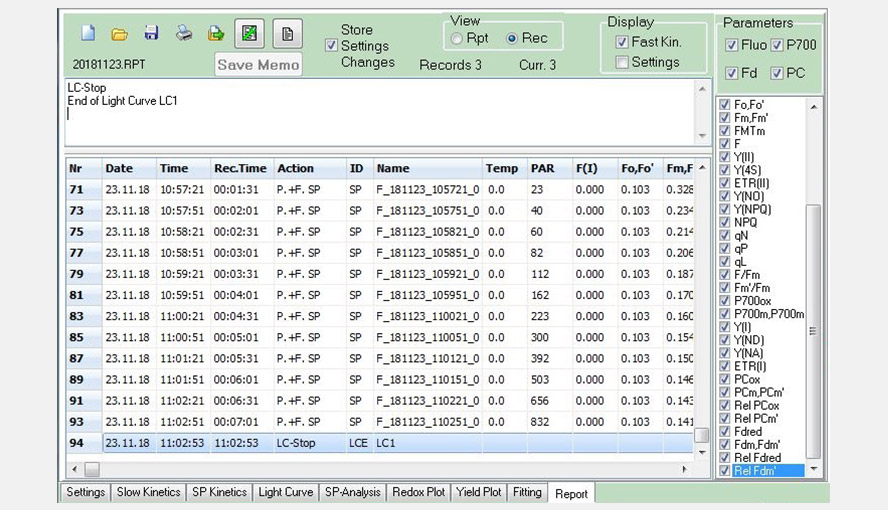
Screenshot of the Report window. The screenshot shows part of the data from a Light Curve experiment saved in a record file.
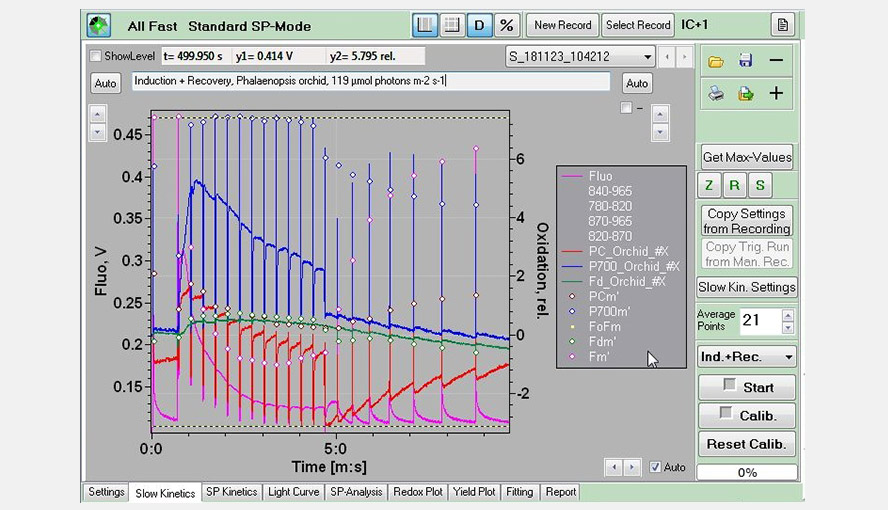
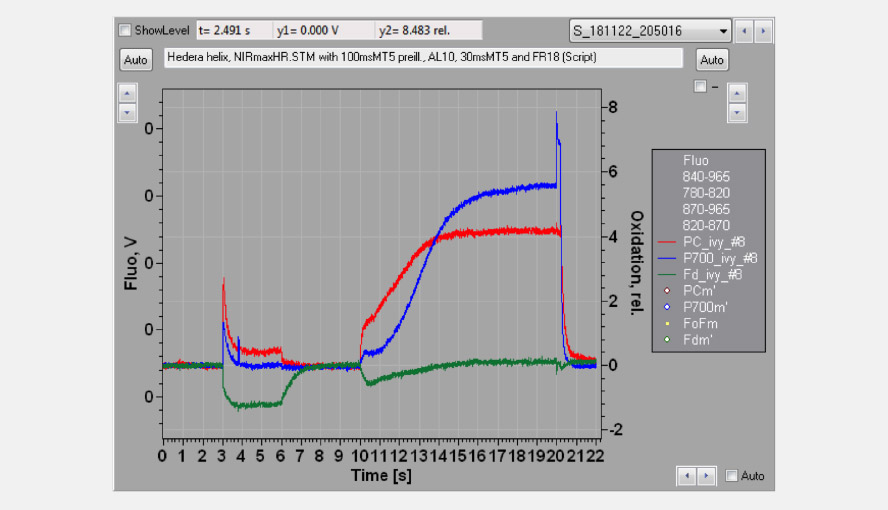
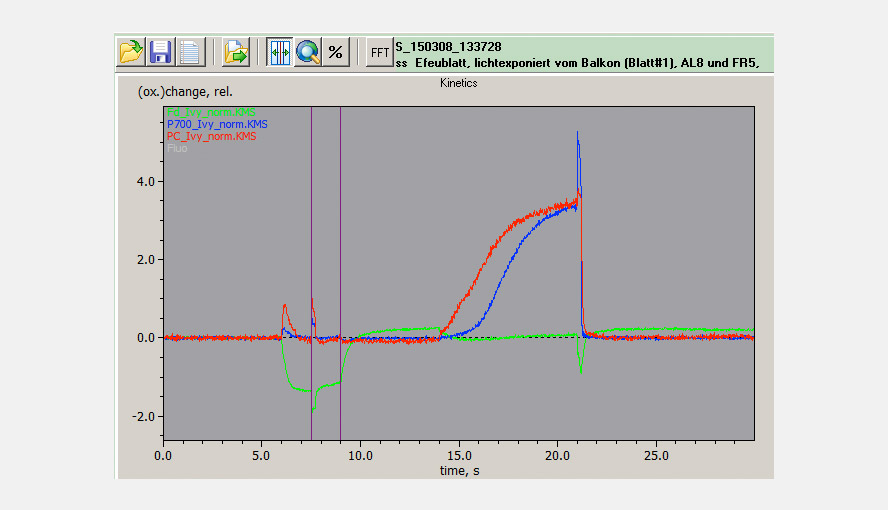
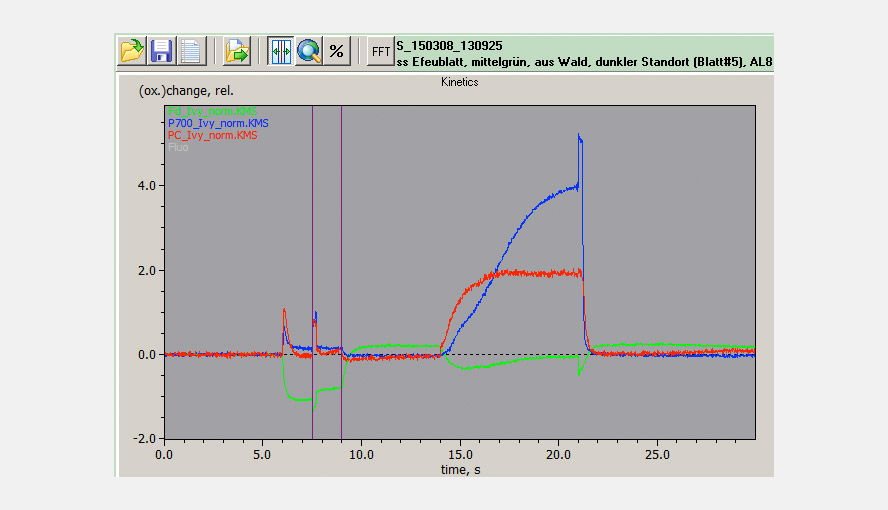
Screenshot of the Slow Kinetics window: An induction (actinic light: 119 µmol photons m-2 s-1) + recovery experiment (pink: Chl fluorescence; red: PC; blue: P700; green: Fd), measured on a Palaenopsis leaf.
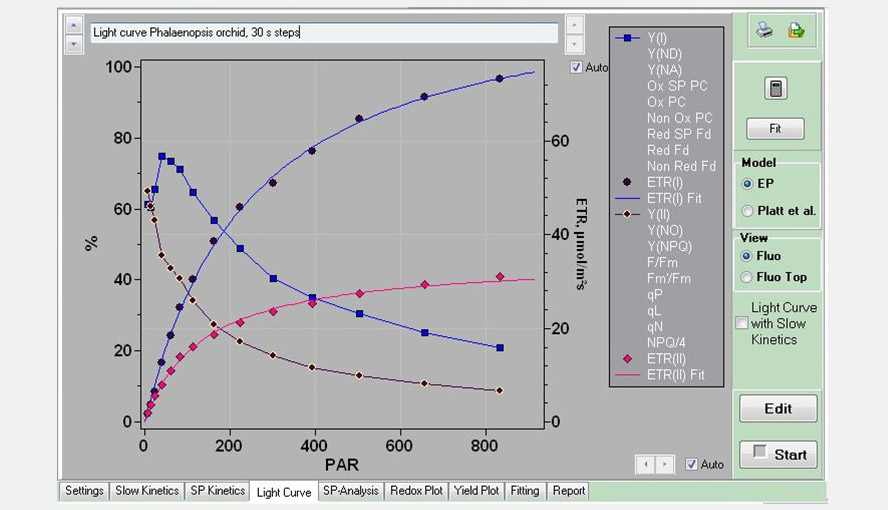
Screenshot of the Light Curve window, with an example of a Light Curve measurement on a Phalaenopsis leaf using 30 s steps. Only the parameters Y(I), ETR(I), Y(II) and ETR(II) are shown. The list on the right hand side of the graph shows all the parameters that can be plotted. The ETR data were fitted with the Eilers and Peeters (1988) model.
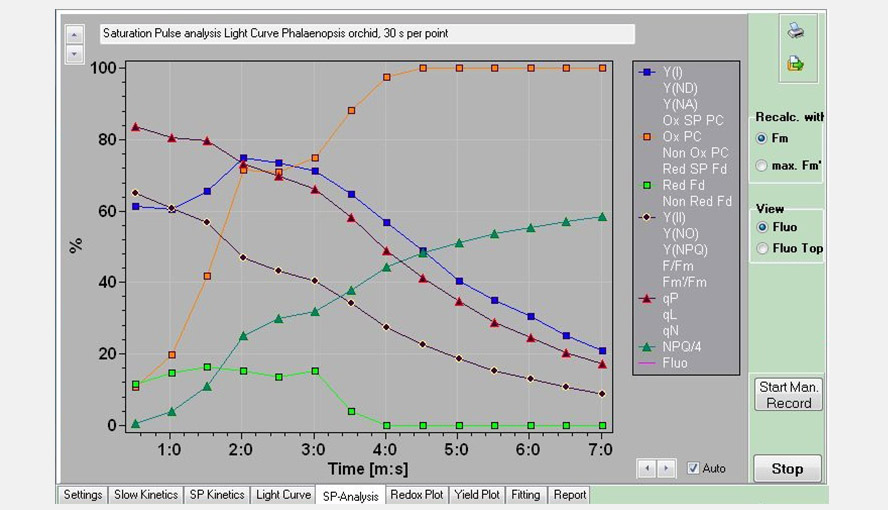
Screenshot of the SP-Analysis window. Several PS I and PS II parameters of the Light Curve experiment are shown as a function of time (each point represents a light intensity). Beyond point 6 (82 µmol photons m-2 s-1) a new phase sets in with PS I becoming more and more oxidized, PS II becoming more reduced and a new phase in NPQ induction.
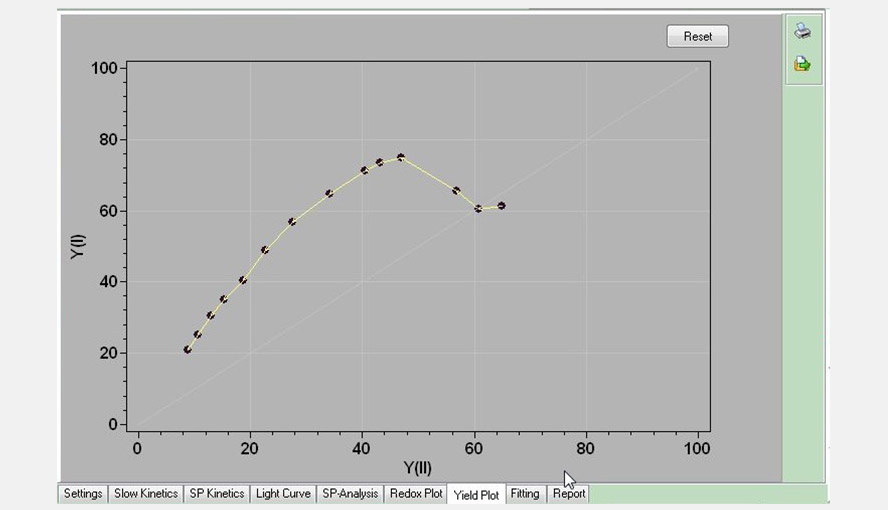
Screenshot of the Yield Plot window: the effective quantum yield of photosystem I (Y(I)) is plotted as a function of the effective quantum yield of photosystem II (Y(II)). Data are taken from the Light Curve experiment shown in an earlier figure. Between ~100 and 830 (the highest intensity measured) µmol photons m-2 s-1 the relationship between the two parameters is approximately linear.
- Power-and-Control-Unit DKN-C:
- Communication: PC interface: USB 1.1, 2.0 and 3.0 compatible
- User interface: Windows computer (Windows 7/8/10) with KLAS-100 software
- Power supply: Windows computer (Windows 7/8/10) with KLAS-100 software
- Power consumption: During basic operation 350 mA
- Sockets: 6 ports for heads (power for single wavelength (2 channels) and double wavelength (4 channels) modulated measuring light, power for 2 actinic LED arrays (one in DKN-E and one in DKN-D) and 1 NIR measuring light LED array (in DKN-E), input for 2 detectors (the photodiode detector of DKN-D is connected to detector 1), socket for stirrer (plus speed controller and standby switch), AUX (for Spherical Micro Quantum Sensor US-SQS/WB or Cosine-Corrected Mini Quantum Sensor US-MQS/WB), USB (for USB cable), TRIGGER OUT (output of 5 V rectangular signals to trigger external devices), 2 EXT. SIGNALS (input for external DC signals. Range 0-1 V or 0-5 V), and CHARGE (for MINI-PAM/L charger).
- Dimensions: 36 cm x 16 cm x 26.5 cm (W x H x D), with carrying handle
- Weight: 5.8 kg
- Emitter unit DKN-E:
- Actinic light: Chip-On-Board LED array (635 nm) for continuous red actinic illumination (max. 2500 µmol photons m-2 s-1 PAR), which can also be used for single turn over flashes (max. 250000 µmol photons m-2 s-1 PAR, length 5-50 µs), and multiple turnover pulses (MT and SP) (max. 25000 µmol photons m-2 s-1 PAR, length 1-1000 ms).
- Dimensions: 5.5 cm x 9 cm x 4 cm (W x H x D)
- Weight: 560 g (incl. cables, 1.4 m long)
- Detector unit DKN-D:
- Actinic light: Blue light (460 nm) for continuous blue illumination (max. 300 µmol m-2 s-1 PAR), Chip-On-Board LED array (635 nm) for continuous red illumination (max. 2500 µmol m-2 s-1 PAR), which can also be used for saturating single turnover flashes (max. 250000 µmol m-2 s-1 PAR, length 5-50 µs), and multiple turnover pulses (MT and SP) (max. 25000 µmol photons m-2 s-1 PAR, length 1-1000 ms), far-red light (740 nm) for continuous far-red illumination (max. 400 µmol photons m-2 s-1).
- Signal detection: Photodiode and pulse preamplifier to measure four dual wavelength NIR-transmission difference signals (780-820, 820-870, 870-965 and 840-965 nm) and two fluorescence signals. Time resolution of a single channel measurement is 35 µs, of a two channel measurement is 150 µs and of a 6 channel measurement is 1 ms. The same detector (protected by the same set of filters) is used for fluorescence and NIR transmission measurements. The filter set passes wavelengths > 750 nm.
- Dimensions: 5.5 cm x 9 cm x 4 cm (W x H x D)
- Weight: 540 g (including cables, 1.4 m long)
- Transport Box DKN-T:
- Dimensions: 60 cm x 40 cm x 34 cm (L x W x H)
- Weight: 5 kg
- Linear Positioning System 3010-DUAL/B:
- Dimensions: 18.5 cm x 11.5 cm x 12 cm (L x W x H, max. without lab stand rod)
- Weight: 1050 g
- Accessories Specifications:
- Design: Cuvette consisting of a sandwich of two 2 x 2 cm aluminum frames, each holding the end part of a Walz standard Perspex rod to connect various measuring heads of the DUAL-KLAS-NIR. Sealing material between frames and leaf: silicon foam gasket. Distance between Perspex rod and leaf: ca. 1 mm on each leaf side. Pneumatically separated upper and lower cuvette halves, controlled by a regulator unit with sockets for cable connections to the 3000 C control unit of the GFS-3000. Leaf area examined: 1.3 cm2. Leaf temperature measurement: thermocouple, range -10 to +50 °C, accuracy ±0.2 °C. External cosine-corrected Micro Quantum Sensor MQS/A for PAR measurements ranging from 0 to 2500 µmol m-2 s-1, accuracy ±5%
- Operating temperature: -5 to +45 °C
- Dimensions: Assembled cuvette: 10 cm x 4 cm x 12 cm (L x W x H), electronic box: 7 cm x 7 cm x 15 cm (L x W x H)
- Weight: Cuvette, regulator unit, cables, and mounting frame: 1.7 kg; mounting stand ST-101: 2 kg
Optical Unit for Suspensions ED-101US/MD:
- Design: Black-anodized aluminum body with central 10 x 10 mm standard glass cuvette; for attachment of Emitter Unit DKN-E, Detector Unit DKN-D and Miniature Magnetic Stirrer PHYTO-MS; additional ports for attachment of two additional Emitter or Detector Units.
- Weight: 750 g
- Temperature Control Block ED-101US/T: Sectioned block with central 10 x 10 mm opening to be mounted on top of the ED-101US/MD unit; to be connected to external flow-through water bath (not included), weight 250 g
- Miniature Magnetic Stirrer PHYTO-MS: Based on device manufactured by h+p (type Variomag-Mini); featuring adapter to be mounted in bottom port of the Optical Unit ED-101US/MD; powered and controlled by the Power-and-Control-Unit DKN-C
- Spherical Micro Quantum Sensor US-SQS/WB: 3.7 mm ø diffusing sphere coupled to integrated PAR sensor via 2 mm diameter fiber; compact amplifier unit and special holder for mounting on Optical Unit ED-101US/MD; to be connected to the Power-and-Control Unit DKN-C
- Temperature Control Unit US-T:
- Display: Three line LCD display
- Control range: 0 °C to 50 °C at 0.1 K steps
- Operating voltage: 11 V – 14 V DC
- Maximum Peltier current: 1 A
- Size: 105 mm x 90 mm x 130 mm (W x H x D)
- Weight: 0.57 kg
- Achievable temperatures: 12 K below ambient temperature, 15 K above ambient temperature (Quartz cuvette placed in Optical Unit for Suspensions ED-101US/MD with 1.5 mL water and stirrer PHYTO-MS on)
- Size: ø 55 mm, 110 mm height
- Cable length: 130 cm
- Weight: 0.29 kg (including cable)
- Input: 100 V – 240 V AC, 1.5 A 50-60 Hz
- Output: 12 V DC, 5.5 A
- Size: 130 mm x 56 mm x 30 mm (L x W x H)
- Weight: 0.50 kg (including cable)
Cuvette for Low-Drift Absorbance Measurements DUAL-K25:
- Design: Quartz glass cuvette, cross section: 10 mm x 10 mm, external dimensions: 12.5 mm x 12.5 mm x 26 mm (L x W x H). Special cuvette holder to position the cuvette between the Detector and Emitter Units DKN-D and DKN-E of the DUAL-KLAS-NIR. U-shaped black-anodized aluminum shields to screen out external light. Three sealing gaskets to protect lower measuring head from spills.
- The DUAL-KLAS-NIR is unique in providing online deconvoluted signals of the in vivo redox states of P700, PC and Fd in real time. This opens up a whole new research field with applications that may not have come to our mind yet. In particular, for the first time simultaneous kinetic information on the complex interplay between reactions at the PS I donor and acceptor sides can be obtained, including information on cyclic electron transport around PS I.
- Some examples of applications, which have been described in Klughammer and Schreiber, Photosynth Res 128 (2016) 195-214, Schreiber and Klughammer, Plant Cell Physiol 57 (2016) 1454-1467 and Schreiber Photosynth Res 134 (2017) 343-360, are given here.
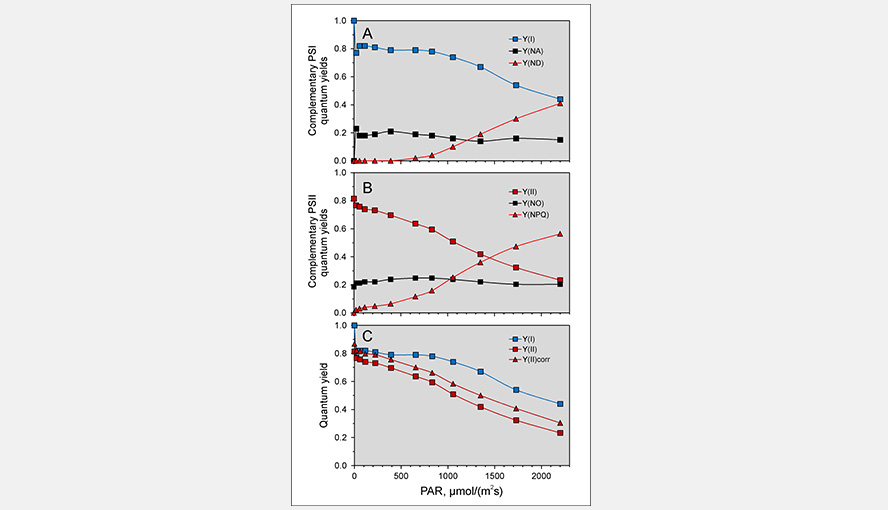
The effective quantum yield of photosystem I. In all older measurements the P700 signal contained always contributions of Fd and variable amounts of PC, depending on the method used to reduce this contribution. Panel C of the figure illustrates the light intensity dependence of the effective PSI quantum yield Y(I), the effective quantum yield of PSII Y(II) and the effective quantum yield of PSII corrected for PSI fluorescence Y(II)corr of Brassica napus.
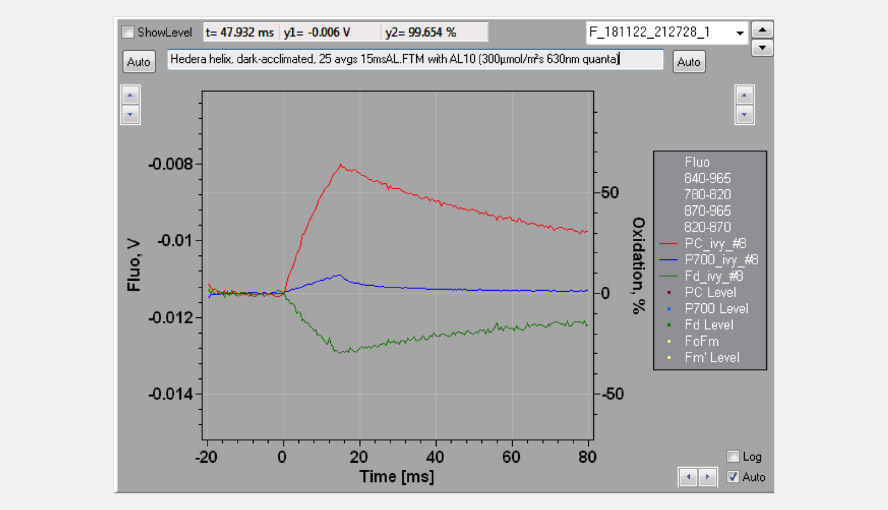
The effective antenna size of photosystem I. On a dark-to-light transition, first oxidized PC starts to accumulate and only with some delay oxidized P700. The initial slope of the clean PC signal can now be used as a measure for the effective antenna size of PS I. The second figure zooms in on the initial absorbance changes and shows the large difference in the initial slope of PC (red) and P700 (blue). For a dark-acclimated leaf, with inactive photosystem I acceptor side, the initial slope of Fd-reduction can also be used for this purpose. The figure illustrates the delay in the oxidation kinetics of P700 relative to those of PC for a barley leaf, which has a relatively high PC/P700 ratio.
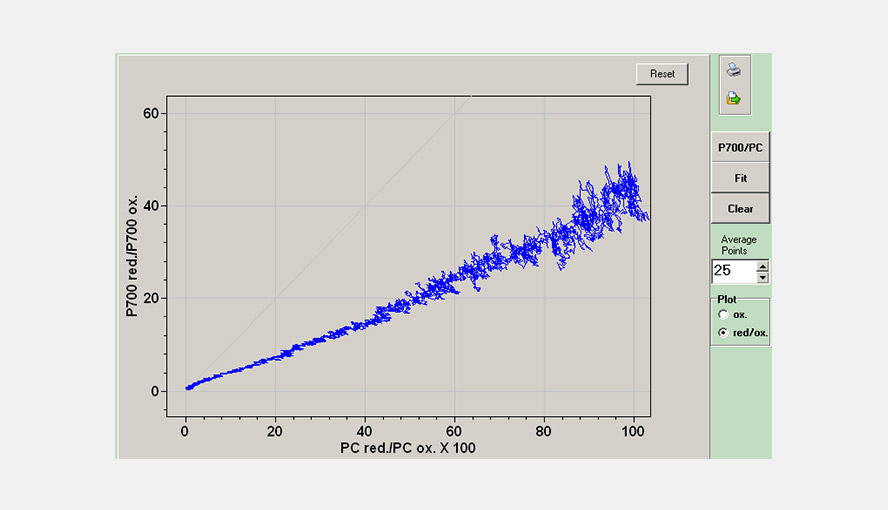
The DUAL-KLAS-NIR has a window to visualize the simultaneous changes in the P700 and PC redox states relative to each other. This allows an estimation of the apparent equilibrium constant between PC and P700. The figure gives an example of a P700 versus PC redox plot.
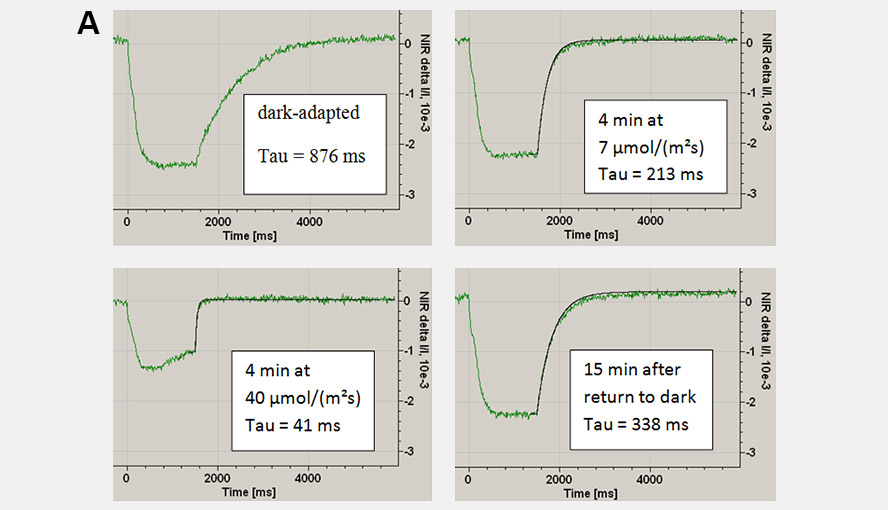
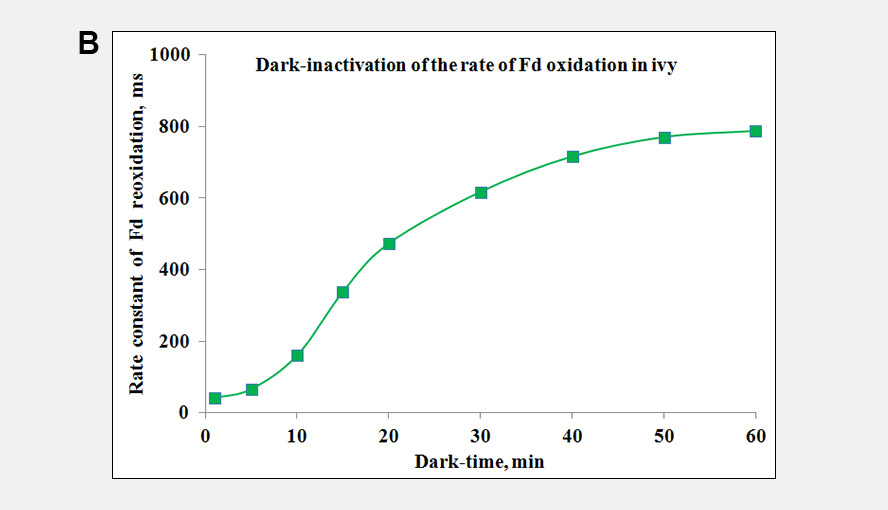
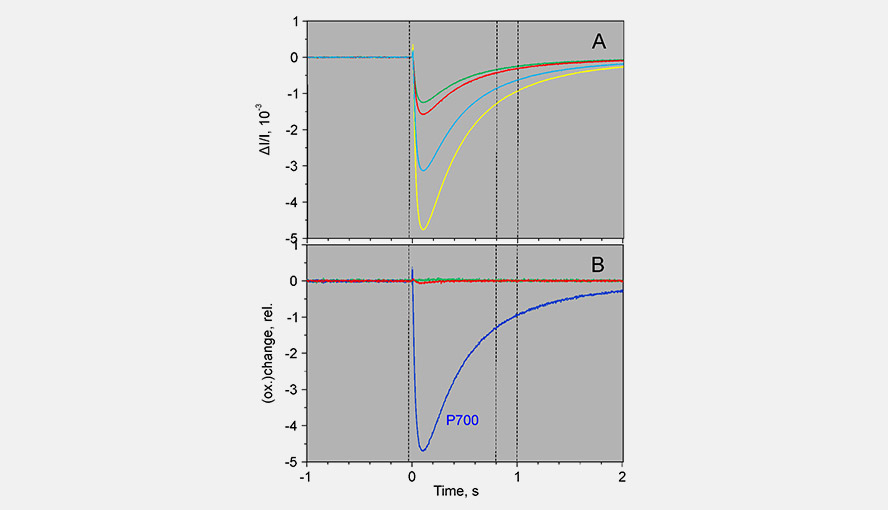
During a saturation pulse given to a well dark-adapted leaf, the Fd-pool becomes reduced and in a subsequent period of darkness slowly re-oxidizes again. When the electron flow on the acceptor side of PSI has become activated the re-oxidation kinetics become much faster. Following activation of the acceptor side of PSI, the dark-inactivation can be followed by monitoring the rate at which Fd becomes re-oxidized following a probe pulse. These kinetics can be fit with an exponential fit routine. Panel A gives examples of the Fd reoxidation kinetics fit with an exponential fit routine and Panel B shows the dark-inactivation kinetics of the acceptor side of PSI for a Hedera helix leaf.
The maximal NIR transmittance changes of PC, P700 and Fd are proportional to the leaf/sample content of these compounds and the ratios of the extinction coefficients of PC, P700 and Fd are constant. This makes it possible to probe the PC/P700 and Fd/P700 ratios and thereby the relative PC and Fd pool sizes in different species or under different conditions (e.g. sun/shade, stressed/non-stressed) on a routine basis with the DUAL-KLAS-NIR. It is observed that high PC/P700 ratios correlate with high ETR values. The figure illustrates that sun and shade leaves of, in this case, Hedera helix have considerably different PC and Fd contents relative to P700.
30 other products in the same category:
-

TAV-C Air...
-
UR-A Air...
-

UR-B Air...
-

UR-C Air...
-
SUT-B Soil...
-
Wet&Dry...
3 990,00 €
-
SCO2-B SCO2...
-

S-NH3...
1 380,00 €
-
S-CO2...
1 695,00 €
-

S-CO...
880,00 €
-

S-H2S...
880,00 €
-
S-CH4...
980,00 €
-

S-NO2...
980,00 €
-

S-O2...
875,00 €
-

LP10-B...
316,50 €
-

LP15-B...
-

LP20-B...
-

LP30-B...
-
LP50-B...
-
LPT20...
-

UTAV-A...
-
UTAV-N...
-
UTAV-B...
-

UTAV-C...
-

LR15-B High...
1 450,00 €
-

LR20-B High...
2 150,00 €
-
LR35-B High...
3 650,00 €
-
WMP4...
3 990,00 €
-
WMP6...
-
WMP6-DL...
5 870,00 €