Sem produtos
Preços sem IVA
Produto adicionado com sucesso ao seu carrinho de compras
Existem 0 produtos no seu carrinho de compras. Existe um produto no seu carrinho de compras.
 View larger


SquirrelView Plus Software
New
Manual Software: SquirrelView Plus ![]()
- Consulta este producto
- Retirar este produto da minha lista de favoritos.
- Adicionar este produto à minha lista de favoritos.
SquirrelView Plus dispone de todas las características de SquirrelView con los beneficios añadidos del análisis gráfico de los datos históricos en-linea, mientras que facilita opciones avanzadas de informes.
SquirrelView Plus allows quick and easily analysis of the Squirrel data in a familiar Explorer navigation-style interface.
Data can be displayed with two different auto scaling Y-axes ─ essential for displaying widely varying data from different sensors on one graph. Particular data of interest can be zoomed into whilst an on-screen cursor can pick out exact values. Data can be shown in a statistical summary with set high and low alarm thresholds. The powerful calculation function allows the creation of “virtual” new channels from existing channels e.g. value from channel 1 added to the average of 10 readings from channel 2 etc.
SquirrelView Plus also incorporates a flexible report generation facility which allows the creation of custom report consisting of a title page with descriptive text, headers and footers, graphs, tabular lists of data, statistics and Squirrel logger set-up information. These can be saved as templates with any of these combinations saving time when preparing similar presentations of data.
- Flexible data presentation allows you to quickly display and analyse real time or historical data as a line graph, bar chart or analogue gauge
- Graphical alarm and event identification lets you easily identify occurrences around specific analogue or digital events, e.g. a pump switching on
- Quick Graph function lets you quickly and easily view large data files
- Wizards for easy set-up of communications and data export
- Ability to send real time metered data from the Squirrel directly into Excel
- Downloader for automating data download using MS Scheduler® (Squirrel 2010, 2020 and 2040 only).
- Fully configurable data views
- Flexible zoom feature including X and Y axes
- Customisable report facility: print out graphs, readings, etc.
- Tolerance curve
- Calculated channels
- Product cure calculation
- Display oven profiles and oven zones
Pacotes de software para configuração, transferência e análise de dados:
SQS100 SquirrelView
Aplicativo de download e exportação de configuração adequado para Windows (download do site).
Windows 10 (incluindo uma avaliação gratuita de 30 dias do SquirrelView Plus).
SQS200 SquirrelView Plus
Fornece análise completa de dados, gráficos on-line, medição, alertas e geração de relatórios. Licença válida por 2 anos.
SQS300 SquirrelView Plus Licença multiusuário
Uso ilimitado do SquirrelView plus em uma única organização. Licença válida por 2 anos
30 other products in the same category:
-
H22-001-CD...
550,00 €
-
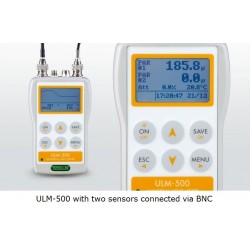
ULM-500...
-
H22-001-S...
430,00 €
-
RX3004-GSM/...
1 309,99 €
-
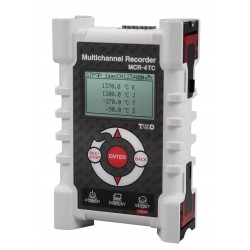
MCR-4TC...
330,00 €
-
Data Logger...
59,00 €
-

MX2203...
159,00 €
-
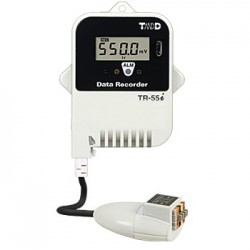
TR-55i-V...
190,00 €
-
RTR-322...
-

DS1922E...
215,00 €
-
DS1922L...
98,00 €
-
DS1922T...
149,00 €
-

DS1921G...
52,00 €
-

DS1922T...
215,00 €
-

DS1922E+DS9...
300,00 €
-

DS1921H-F5...
43,00 €
-
DS1921Z...
58,00 €
-
DS1923-F5...
195,00 €
-
DS1921K Kit...
105,00 €
-
DS1904L-F5...
14,00 €
-
UA-001-64...
89,00 €
-

UA-002-64...
109,00 €
-
Data Logger...
135,00 €
-
DS1996L-F5...
-

Tempmate-M1...
48,00 €
-
Tempmate.®-...
25,00 €
-
Meteo-Case-...
-
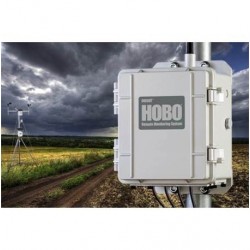
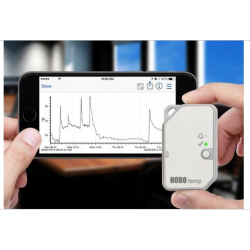
HOBO Prov2...
-

UX90-001...
145,00 €
-

UX90-002...
145,00 €