No products
Prices are tax excluded
Product successfully added to your shopping cart
There are 0 items in your cart. There is 1 item in your cart.
")
")
")
")
")
")
")
")
")
")
")
")
")
PAM-2500 High-performance Field and Laboratory Chlorophyll Fluorometer (WALZ)
PAM-2500
New
High-performance Field and Laboratory Chlorophyll Fluorometer.
Major Points of the PAM-2500:
Saturation pulse as well as polyphasic rise analysis with time resolution down to 10 μs
Latest generation light-emitting diodes for all internal light sources
High sensitivity enabling high quality measurements with dilute suspensions of algae and cyanobacteria.
- More info about this product.
- Remove this product from my favorite's list.
- Add this product to my list of favorites.
| Type of Instrument | Chlorophyll Fluorometers |
| The instrument measures: | Chlorophyll Fluorescence |
-
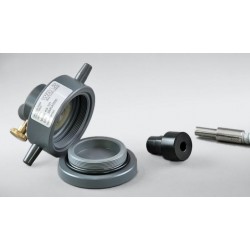
KS-2500 Suspension Cuvette WALZ
1 200,00 €
The PAM2500 Chlorophyll Fluorometers are successors to the well-known PAM-2000/2100 instruments that were introduced in the 1990s as the first portable PAM fluorometers. Since then, they have been successfully applied around the world by numerous scientists.
In the development of the PAM2500, particular care was taken to maintain all properties appreciated by PAM-2000/2100 users and, at the same time, to integrate state-of-the-art technology.
Essentially, the hardware and optical system are thoroughly modernized. Also, while continuing basic elements of the graphical user interface, instrument operation is based on the newly-developed PamWin-3 software.
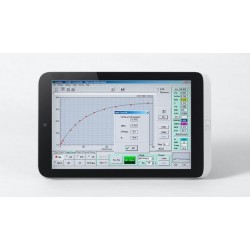
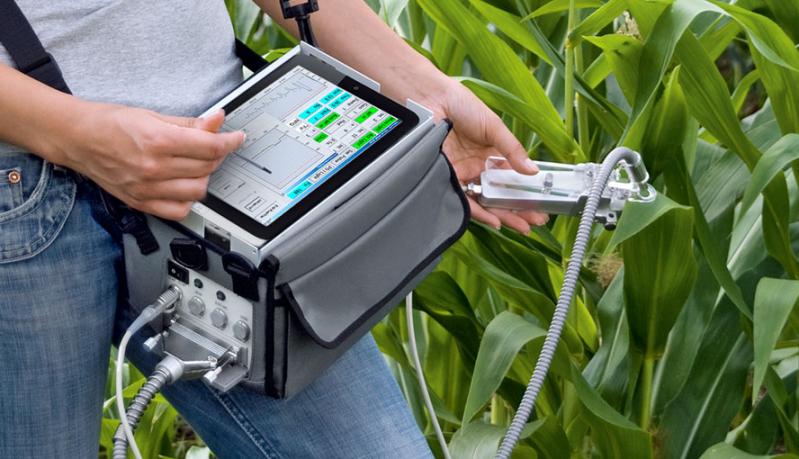
The program permits operation under Windows operating systems on normal personal computers, but also on ultra mobile touch screen computers (UMPC).
Major Points of Progress of the PAM2500:
- Saturation pulse as well as polyphasic rise analysis with time resolution down to 10 μs
- Latest generation light-emitting diodes for all internal light sources
- High sensitivity enabling high quality measurements with dilute suspensions of algae and cyanobacteria.
FEATURES:
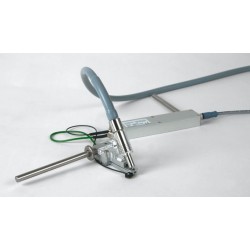
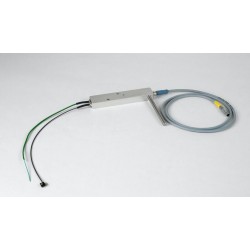
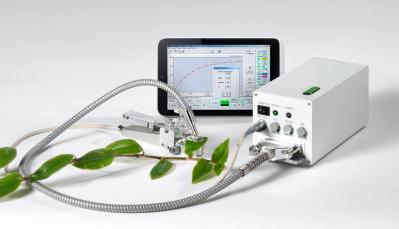
- The PAM2500 chlorophyll fluorometer is an extremely compact and powerful measurement system. All optical and electronic components are housed in a 23 cm x 10.5 cm x 10.5 cm housing. The PAM2500's light sources are light emitting diodes (LEDs) that allow for almost rectangular light intensity changes.
- The PAM2500 uses a 630nm measurement light consisting of 1μs pulses given at frequencies from 10Hz to 200kHz. A Chip-On-Board LED matrix provides strong 630nm red actinic light. The fluorometer also features a blue actinic light source that has the emission peak at 455nm. Furthermore, a far red LED with a peak at 750 nm allows selective excitation of PS I.
CONFIGURATIONS:
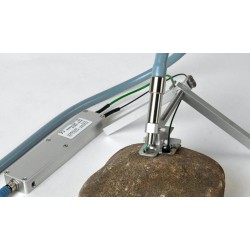
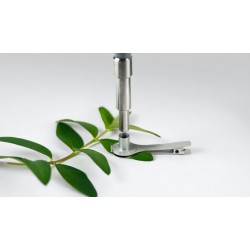
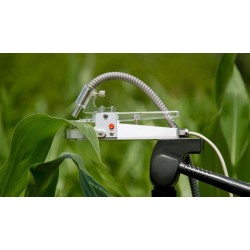
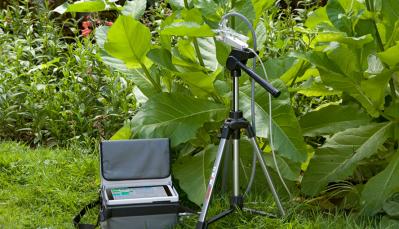
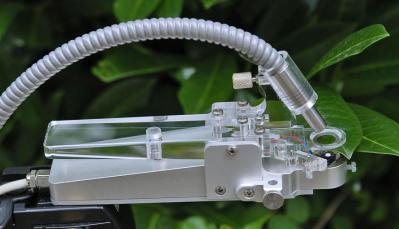
- The PAM2500 chlorophyll fluorometer can be configured for measurements of leaves and suspensions. In both cases, a flexible optical fiber guides modulated measuring light as well as actinic light to the sample, and collects the chlorophyll fluorescence.
Independent of configuration, the use of power LEDs results in high actinic intensities of up to 2000 μmol m-2 s-1 and single turn-over flash intensities up to 125,000 μmol m-2 s-1 at sample level. Additionally, the PAM2500 features blue actinic light up to 800 μmol m-2 s-1 and an efficient far red light source.
- For leaf measurements, the sample is positioned relative to the fiber by special leaf clips. The use of the light-sensing leaf clip 2030-B is particular advantageous as it permits deriving relative electron transport rates from PAR measurements and PS II photochemical yields, Y(II). Also, the 2030-B clip measures leaf temperature by a thermoelement.
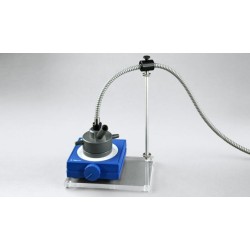
To examine suspensions of isolated chloroplasts, algae or cyanobacteria, the fiberoptics is plugged in the special cuvette KS-2500. The cuvette can be used in combination with a magnetic stirrer and temperature control.
Fluorometer / General Design
- Signal detection: PIN-photodiode protected by long-pass filter (T(50%)=715 nm). Selective window amplifier
- Sockets: Connector for Special Fiberoptics 2010-F. USB socket. Sockets for Leaf Clip Holder 2030-B or Micro Quantum/Temperature-Sensor 2060-M, Battery Charger MINI-PAM/L or external 12 V battery via MINIPAM/AK cable, and external lamp/trigger output
- Communication: USB. Bluetooth Version 2.0 + EDR Class 2
- User interface: Windows computer with PamWin-3 software
- Power consumption: Basic operation 1.6 W, 8 W with all internal light sources operated at maximum output (measuring light, red and blue actinic light, and far red light). Saturation pulse at maximum intensity, 30 W
- Power supply: Rechargeable sealed lead-acid battery 12 V/2 Ah; Battery Charger MINI-PAM/L (100 to 240 V AC)
- Recharging time: 6 hours (with the PAM-2500 turned off) via Battery Charger MINI-PAM/L
- Operating temperature:-5 to +40 °C
- Operating humidity range: 20 to 95% RH to avoid condensation
- Dimensions: 23 cm x 10.5 cm x 10.5 cm (L x W x H) aluminum housing
- Weight: 2.5 kg (including battery)
Fluorometer / Light Output
- Measuring light: Red LEDs, maximum emission at 630 nm, FWHM (full width at half maximum) 20 nm. 1 μs pulses at modulation frequencies 10 to 5000 Hz for Fo determinations (200 Hz default), and 1 to 100 kHz during actinic illumination, fast kinetics with 100 or 200 kHz, 20 intensity levels, frequency dependent effective PAR ranging from 0.001 to 100 μmol m-2 s-1
- Blue actinic light: LEDs, maximum emission at 455 nm, FWHM 20 nm, PAR up to 800 μmol m-2 s-1, 20 intensity levels
- Red actinic light: LEDs, maximum emission at 630 nm, FWHM 15 nm, PAR up to 4000 μmol m-2 s-1, 20 intensity levels
- Saturation pulses: Red LEDs (see red actinic light), PAR up to 25000 μmol m-2 s-1, adjustable between 0.1 and 0.8 s, 20 intensity levels
- Multiple turn-over flashes: Red LEDs (see red actinic light), PAR up to 25000 μmol m-2 s-1, adjustable between 1 and 800 ms, 20 intensity levels
- Single turn-over flashes: Red LEDs (see red actinic light), PAR up to 125000 μmol m-2 s-1, adjustable between 5 and 50 μs
- Far-red light: LED, maximum emission at 750 nm, FWHM 25 nm, 20 intensity levels
Light Saturation Curves of the Apparent Electron Transport Rate
A major application of PAM-2500 fluorometers in ecophysiology consists in the fast and reliable analysis of the photosynthetic performance of plants.
Two important parameters for characterizing photosynthesis are the maximum quantum yield for whole chain electron transport (“alpha”, at low light intensities) and the maximum electron transport capacity (“ETRmax”, at light saturation).
To evaluate the alpha and ETRmax, apparent electron transport rates (ETR) are derived from effective quantum yields of photosystem II (ΔF/Fm' or Y(II)) according to ETR = Y(II) x PAR x 0.42.
In this equation, the PAR corresponds to the quantum flux density of photosynthetically active radiation, and the 0.42 is the product of light absorptance by an average green leaf (0.84) times the fraction of absorbed quanta available for photosystem II (0.5).

In the given example, the intensity of red actinic light is increased stepwise every 3 minutes. At the end of each intensity step, fluorescence ratio parameters including Y(II) are assessed with the help of a saturation pulse. While Y(II) decreases with increasing PAR, ETR first rises and then levels off at high PAR values. Fitting a theoretical function (see black line) to the data points yields estimates for the alpha and ETRmax. All saturation pulse data are stored in a report file from where they can be exported to spread-sheet programs, like Excel, e.g. for graphical display of light saturation curves.
Polyphasic Fluorescence Rise Upon Onset of Saturating Light
The fast acquisition mode of the PAM-2500 enables recordings of rapid fluorescence kinetics with 10 µs time resolution. It may be emphasized that this high time resolution is achieved with pulse modulated signals.
This means that the fast kinetics of fluorescence yield is measured and, consequently, that signal amplitudes from different experiments can be directly compared irrespective of light intensity and sample geometry.
The same saturating light that serves for saturation pulses can also be used for measuring the polyphasic fluorescence rise kinetics. This type of kinetics provides valuable information on the properties of PS II and the state of its primary and secondary acceptor pools.
With a dark-acclimated sample, four characteristic levels of fluorescence yield can be distinguished in a plot with logarithmic time scale: Fo, I1, I2 and Fm (alternatively also denoted O, J, I and P).![]()

The Fo-I1 (or O-J) transient directly reflects the closure of PS II reaction centers by charge separation (QA-reduction). The rate of this transient is proportional to the applied light intensity (photochemical phase). At a given high light intensity, the rate provides a relative measure of the optical absorption cross-section of PS II. The I1-I2-Fm (or J-I-P) transients reflect the reduction of secondary acceptor pools (mainly plastoquinone), the rate of which is limited by dark reactions (thermal phases). Clear-cut separation of photochemical and thermal phases (pronounced I1 plateau) is favored by the very high light intensities provided by the PAM-2500 (up to 25,000 μmol m-2 s-1). For reproducible results, defined reduction-oxidation states are essential which can be obtained by defined far-red preillumination.
30 other products in the same category:
-

TAV-C Air...
-
UR-A Air...
-

UR-B Air...
-

UR-C Air...
-
SUT-B Soil...
-
Wet&Dry...
3 990,00 €
-
SCO2-B SCO2...
-

S-NH3...
1 380,00 €
-

S-CO2...
1 180,00 €
-
S-CO...
880,00 €
-

S-H2S...
880,00 €
-
S-CH4...
980,00 €
-

S-NO2...
980,00 €
-

S-O2...
875,00 €
-

LP10-B...
316,50 €
-

LP15-B...
-

LP20-B...
-

LP30-B...
-
LP50-B...
-
LPT20...
-

UTAV-A...
-
UTAV-N...
-
UTAV-B...
-

UTAV-C...
-

LR15-B High...
1 450,00 €
-

LR20-B High...
2 150,00 €
-
LR35-B High...
3 650,00 €
-
WMP4...
3 990,00 €
-
WMP6...
-
WMP6-DL...
5 870,00 €